Review
General Company Information
Darwinex Zero is a platform developed by Darwinex that allows traders to demonstrate their skills without the risk of losing their own capital. It offers a simulated account where users trade under real market conditions, with the possibility of receiving real capital allocations if they perform well.
Although it may sound similar at first, Darwinex is very different from all other current funding companies, both in how it operates and in the conditions for its traders. Among the most important is the complete absence of rules, one of the most delicate aspects when it comes to achieving profitability from other funded accounts.
Operation
Darwinex Zero is a monthly subscription service that allows you to access a demo account with real-life market conditions. Trades made in this account will be analyzed by the platform’s risk engine, then adjusted and copied to our partner Darwin.
A Darwin is an investable instrument with a 15% management fee for the trader. This means that if there is capital in our Darwin and we generate profits, we will earn 15% of those profits.
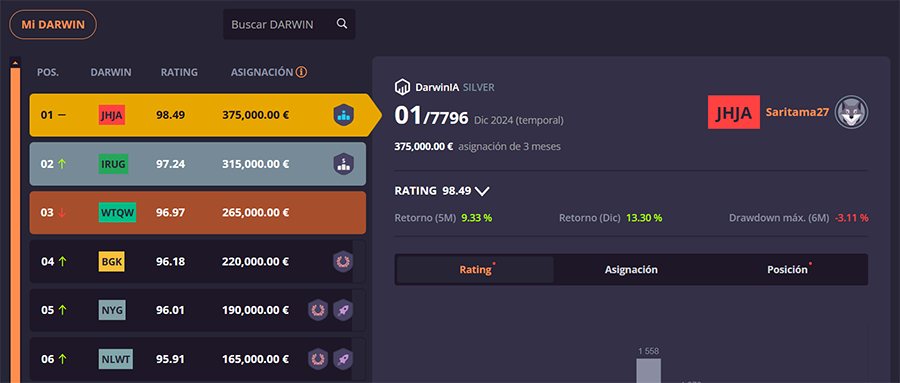
There are two ways to raise investment: through private investors (limited until we reach DarwinIA Gold) and DarwinIA, a monthly ranking system in which we compete with other Darwins to raise investment from Darwinex funds, known as seed capital.
Darwinex vs Darwinex Zero
Darwinex is a broker founded in 2012 that allows trading in CFDs, futures, stocks, and ETFs. Darwinex was founded with the mission of bringing third-party capital management closer to retail investors. Thanks to its risk engine, Darwinex optimizes traders’ strategies, maximizing profits and minimizing losses for its investors.
To own a Darwin with Darwinex, you must have an account with at least $1,000 in equity maintained over time. While this isn’t an exorbitant amount, it poses the problem of still putting our own money at risk.
On the other hand, we have Darwinex Zero, an initiative born with the idea of creating a safe environment where traders of all levels could have a successful trading career. Now, for an affordable monthly subscription, we have access to a $100,000 demo account and the ability to manage large sums of real capital with great ease.
Rules
It may seem unbelievable, considering what we are used to with funding accounts, but at Darwinex Zero THERE ARE NO RULES.
Plans and price
| Monthly | 1 year | 3 years | |
|---|---|---|---|
| European Price | €38 | €405 | €1095 |
| Rest of the world price | $43 | $460 | $1240 |
Restart
You can reset your account at any time, and it costs the same as a monthly fee. This reset is basically like deleting your old account and creating a new one, so you’ll need to go through the calibration phase again.
Multiple accounts
Multiple accounts are permitted, but not with the same subscription. To create a new Darwin, you must create another account with a different email address and pay for another subscription.
Capital Management
One of the key features that sets Darwinex Zero apart is the fact that we can access real capital to manage and profit from. This was exactly what we were sold at the beginning of the modern prop firm era. However, reality soon unfolded: after passing a funding test, all we got was another demo account, from which, at most, trades were copied and taken to the real market.
Darwinex Zero completely changes the rules of the game, offering the opportunity to trade like a professional, managing real money, without excessive rules whose sole objective is simply to make your account go down.
At Darwinex Zero, we can manage two types of capital: seed capital and capital from external investors.
Seed capital
Seed capital is, in short, the proprietary money that Darwinex makes available to its top-performing traders. Through the DarwinIA program, eligible traders will receive allocations ranging from $30,000 to $500,000.
The duration of these assignments is limited, being 3 months in the case of DarwinIA Silver, and 6 months in the case of DarwinIA Gold.
Capital from external investors
Darwinex Zero Darwins that have managed to be in the DarwinIA Gold division at some point become public and anyone can invest in them.
This type of capital is much harder to come by, as investors will be much more selective when choosing their strategies, typically prioritizing those with a track record of more than three or four years. However, this type of investment has no time limit and the potential for scaling is much higher. The most popular Darwins today manage several million dollars each.
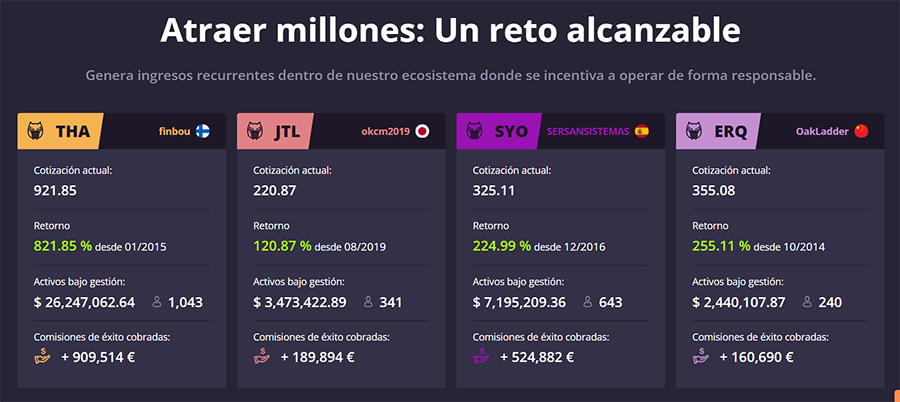
Management fee / Profit sharing
When you generate a positive return on an equity investment, you’ll earn a 15% management fee. This return is defined based on the watermark concept I discuss later.
Lifetime allowance
One of the biggest issues Darwinex Zero has had since its launch has been the high rate of Darwin resets by its users.
The ultimate goal of every trader on this platform should be to manage a large amount of investor capital, but this is only possible with a long track record (the minimum is considered to be at least two years). It’s normal to have bad runs over such long periods of time, but many traders choose to reset that track record rather than struggle to recover.
Darwinex Zero wants to maximize the number of long-term Darwins, and that’s why it has decided to add an incentive to make the option of starting over much less attractive.
Operation
Once you understand how the program’s seed capital allocations work, the permanent allocation is straightforward. We pay an initial fee, and when we reach the target price, we receive an allocation of $150,000. The duration is three months, similar to the DarwinIA Silver program, and it will be renewed indefinitely at the end of each cycle.
Once we have achieved the allocation and thanks to the watermark reset with the seed capital, it will be quite easy to get commissions sooner or later, even if we are losing in the long term.
Plans
| Price | Target Growth | Permanent Allocation |
|---|---|---|
| €540 | 5% | $100,000 |
| €320 | 10% | $100,000 |
| €220 | 15% | $100,000 |
| €160 | 20% | $100,000 |
Calibration phase
Once the account has been created and the initial payment made, we enter the calibration phase. The risk engine that transforms our trades into signals for Darwin needs to analyze our operations beforehand. During this phase, we must operate normally for a minimum period of 15 days, and up to a maximum of 90 days.
A bar will appear on your profile showing your current progress in required trading operations and minimum trading days.
Phase passed
Once the requirements are met, a countdown will appear on the dashboard for Darwin creation. During this time, you can continue trading normally, and all trades will be included in Darwin, as well as those made during the calibration phase.
Darwin
A Darwin is an investable index whose valuation is based on a trader’s transactions. When someone invests in a Darwin, their capital will be used to replicate the transactions of the Darwin manager.
There’s also a key factor in the equation: Darwinex’s risk manager. This risk engine continuously analyzes the trader’s trading history and applies a multiplier to the leverage to achieve an optimal risk level.
Underlying account
The underlying account for a Darwin is the account the trader uses to make their trades. At Darwinex Zero, it’s a $100,000 account for CFDs and a $1 million account for futures. At Darwinex, the underlying account is the trader’s personal account.
It’s possible that the underlying account’s performance may not match that of Darwin due to the intervention of the risk engine. The most common case, which can affect most Darwins, is the simple multiplier effect. In this case, the leverage will increase or decrease, but the profit curve will have the same shape.
There may be other cases where, due to trader inconsistency or specific moments of extreme market volatility, the shape of the profit curve is altered. In these cases, a trader who is a winner in their underlying account may have a losing Darwin, and vice versa. This is why it is essential to understand how the risk engine works.
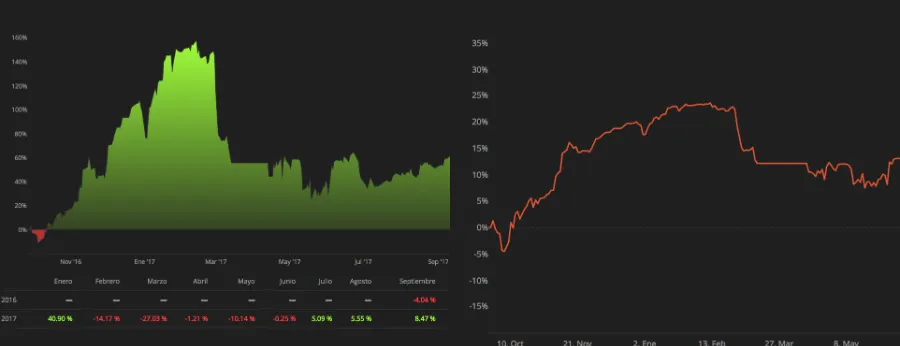
In this image, you can see the underlying account curve on the left and the Darwin curve on the right. First, we can see that the Darwin curve is much smoother; it rises less than the underlying account, but it also falls less than the underlying account. This is because the risk engine detected an abnormally high exposure and reduced positions to reduce volatility.
On the other hand, we can see how the profitability managed by the underlying account is much higher than that of Darwin. The maximum for the underlying account is around 150%, while that of Darwin doesn’t seem to exceed 25%. The reason for this is that the trader’s overall risk management is too aggressive by Darwinex standards. Consequently, the risk engine applies a multiplier less than 1 to reduce exposure. In this case, based on the aforementioned maximums, we can deduce that the multiplier should be around 0.2.
Price
The quote is a value that reflects Darwin’s profit since its inception, and increases 1 point for every 1% of profit. For some reason unknown to me, the quote starts at 100. A quote of 130, for example, would have a historical profit of 30%.
Divergence
Divergence is the difference between the theoretical return of a Darwin and the actual return achieved by investors. Depending on the trading style and the amount of capital under management, this difference can be negligible or critical. There are two main reasons why this divergence occurs:
- Latency. The time it takes for the Darwin platform to copy the trader’s trades and bring them to the market.
- Slippage. When a Darwin manages a lot of capital and trades with large volumes, these transactions can affect market liquidity and create slippage, i.e., buying and selling at prices that are worse than the theoretical prices at that particular moment.
In my interpretation, divergence will have a greater impact on strategies with short trading durations and a lesser impact on strategies with long trading durations. This is because the shorter the trading duration, the lower the volatility, and the greater the leverage required to make a significant profit. Furthermore, the shorter the trading duration, the greater the importance of executing the trade at the optimal price, so slippage will have a greater influence.
I also believe the profit factor may be the second key factor. Strategies with a low profit factor need to make more trades to achieve the same profitability. The more trades, the greater the impact of both latency and slippage.
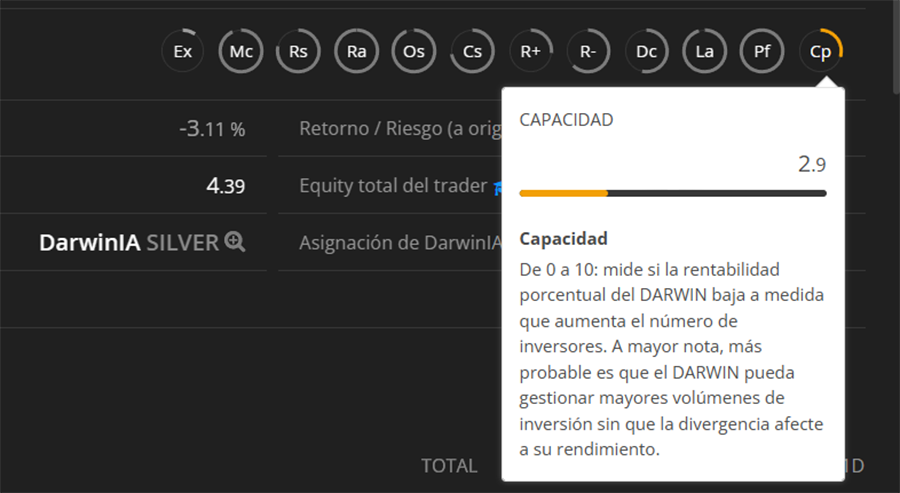
On the Darwinex website (not Darwinex Zero), there’s a panel with advanced statistics for each Darwin. One of these is capacity, which is directly related to divergence.
Watermark
The watermark is the method used to determine the performance fee the trader will receive for each capital allocation. There are two types of watermarks: one for capital from external investors and another for DarwinIA’s seed capital.
Watermark for external investors
This would be the classic concept of a watermark. Each time a three-month cycle ends, if the managed capital balance reaches an all-time high, this value becomes the watermark. For subsequent cycles, the managing trader will only receive a portion of the profits when the new watermark is higher than the previous one. The profit will be calculated based on the difference between the new and previous watermarks.
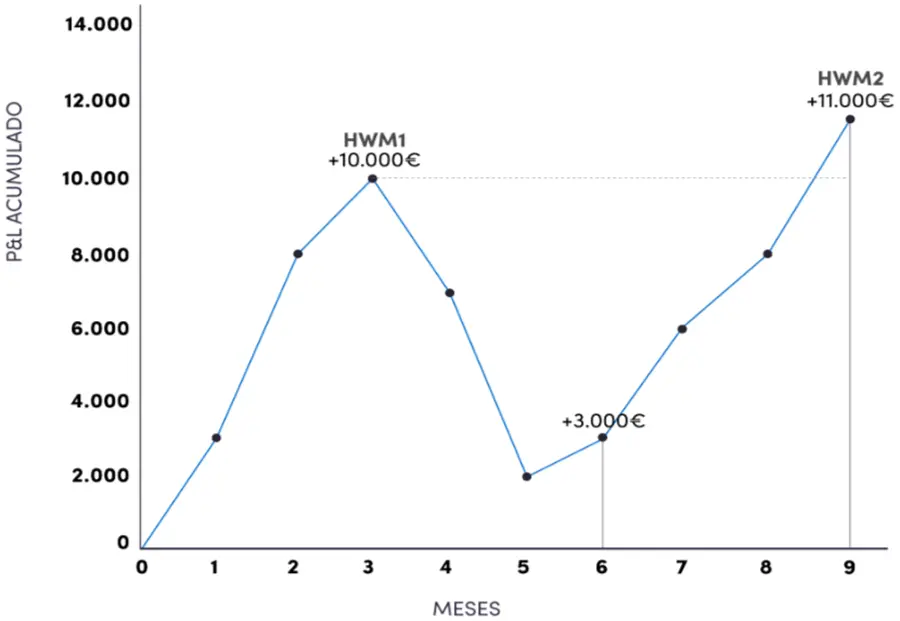
In this example, we can see how, six months after the last high, we reached a new high $1,000 higher than the previous high, becoming the new high. This means we will have generated a profit of $1,000 on the managed capital, from which we will receive our performance fee.
Watermark for seed capital
When managing DarwinIA seed capital, the process is slightly different. To make it easier for traders to generate commissions, the watermark will be reset under certain circumstances:
- When all of a Darwin’s capital allocations expire in losses. In this case, the watermark is completely reset to the current level.
- When a Darwin receives a new allocation, but previous allocations have a loss greater than 5%. In this case, the watermark is set to 5% below the last watermark.
Risk Engine
The risk engine is a proprietary Darwinex algorithm that manages Darwin risk so that they meet the platform’s standard target risk of 6.5% monthly VAR. It does this by copying traders’ signals and adjusting the lot size of trades that go live.
VaR
VaR (Value at Risk) is a value that represents the estimated risk of a trading strategy. It consists of three elements:
- The minimum expected loss
- The time required for that loss to occur
- The probability of this loss occurring
The target VaR for any Darwin is 6.5% per month with a 5% probability. This means that, for each month traded, there is a 5% chance of losing 6.5% of the capital under management.
The reason for this VaR value and not another is that Darwinex has conducted a statistical study to determine the risk that provides the optimal balance between maximizing profits and minimizing losses.
How is VaR calculated?
I won’t go into the technical details of how the calculation is performed here, among other things because I might add some incorrect information, but I will mention the factors involved. Knowing this is key to maintaining a healthy Darwin system that replicates our operations optimally.
- Number of operations: The more operations, the higher the VaR.
- Leverage: The higher the nominal leverage of our positions, the higher the VaR.
- Duration of operations: The longer the duration, the higher the VaR.
- Volatility: The higher the volatility of our positions, the higher the VaR.
- Correlation between positions: The greater the correlation between positions, the greater the VaR.
Likewise, it is also important to know that VaR is calculated using the last 45 active trading days.
D-Leverage

D-Leverage is a value used on the Darwinex platform to represent the leverage level of a Darwin. The difference between D-Leverage and the commonly used nominal leverage is that nominal leverage does not take into account the asset’s volatility.
Investing 5% of your account in EURUSD, gold, or the SP500 isn’t the same. Each instrument has a different volatility and, therefore, can pose a different risk.
In addition to leverage and asset volatility, D-Leverage also takes into account the correlation between positions. The more correlated a Darwin’s positions are, the higher the D-Leverage.
Finally, the volatility of the EURUSD pair is used as a reference. The D-Leverage value of a Darwin’s set of positions represents the equivalent nominal value in the EURUSD pair.
How does the risk engine work?
To achieve the target VaR, Darwin’s risk engine calculates the underlying account’s VaR and applies a multiplier, also known as the VaR ratio. This multiplier is applied not only when positions are opened, but also throughout their duration.
On the other hand, there is an emergency mechanism that directly closes a portion of transactions when the underlying account risk increases significantly and abnormally.
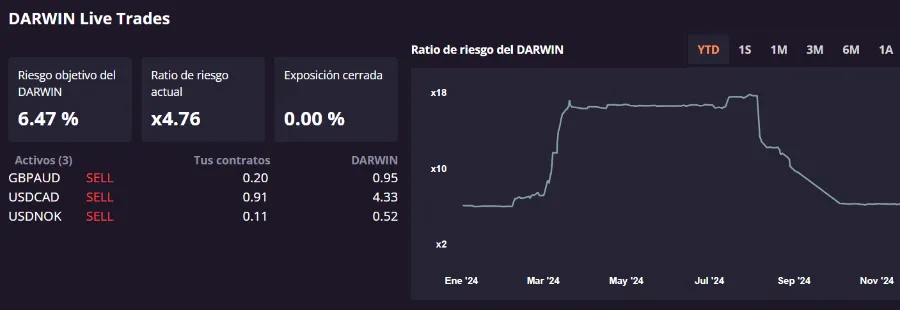
In this screenshot of the Darwinex Zero dashboard, we can see the values we just discussed in practice.
- The Target Risk of the Darwin is the VaR that the Darwin has right now after applying the multiplier.
- The Current Hazard Ratio is what I call the multiplier.
- Closed Exposure or Closing Rate is the percentage of positions closed by the risk engine. This value, ideally, should never exceed 0%. If it’s higher in a specific situation or at a critical market moment, it’s fine, but if it’s higher repeatedly, it means we’re not being consistent with our strategy, and the risk engine won’t be able to manage it properly.
- Open positions. Here we can see how the leverage of positions in Darwin is equal to the leverage of the underlying account multiplied by the current risk ratio.
- Finally, on the right we have the multiplier history, showing in a graph the values it has had over time.
DarwinIA
DarwinIA is a monthly competition open to both Darwinex Zero and Darwinex traders. It’s divided into two divisions: DarwinIA Silver and DarwinIA Gold. The rewards for achieving a good position (or a minimum score) are the allocation of seed capital, which we can manage with our Darwin to make a profit.
Rating
The rating is the value with which a Darwin competes in DarwinIAE. It can range from 0 to 100 and represents how well the Darwin has performed over the past 6 months. The rating is calculated based on three factors, each with a different weight:
- Current month profit (22%)
- Accumulated profit from the previous 5 months (67%)
- Maximum drawdown in the last 6 months (11%)
This scoring system rewards consistency and perseverance. It won’t do much good to do very well one month if the previous months have been poor.
DarwinIA Silver
This is the basic split, and anyone with an active Darwinex Zero subscription or a Darwinex subscription can participate.
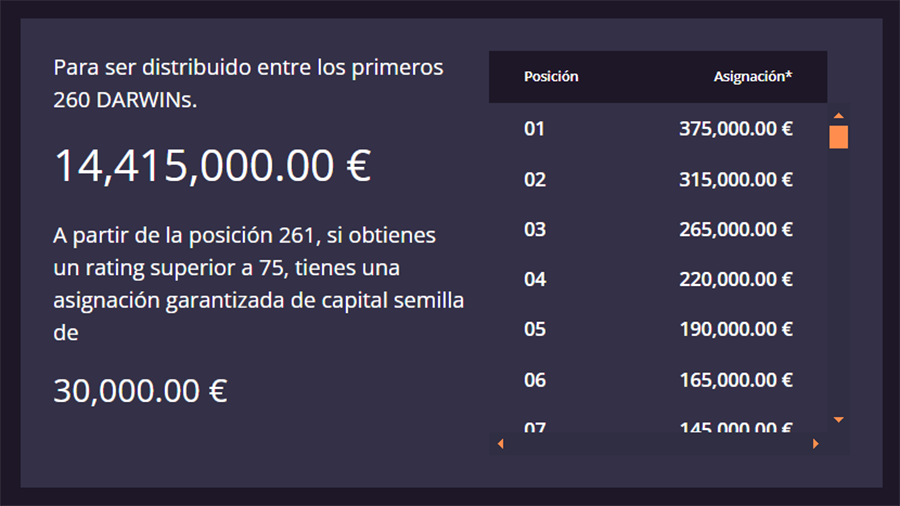
All traders who achieve a score of at least 75 will receive a seed capital allocation of $30,000 for 3 months.
From here on, depending on the moment, a certain number of Darwins who finish in the top positions will win prizes of up to $375,000. At the time of writing, these are the available prizes.
DarwinIA Gold
The best DarwinIA Silver traders have the opportunity to upgrade. DarwinIA Gold features include:
- There is a limited number of Darwins that can be allocated. This depends on the total number of Darwins in DarwinIA Gold. At the time of writing this guide, there are 221 Darwins in the category; 72 of them can be allocated. These range from $50,000 to $500,000.
- The rating is not valid and there is no guaranteed allocation above a certain level.
- The duration of the assignments is 6 months, instead of the 3 months of DarwinIA Silver.
- There are several requirements to advance to DarwinIA Gold. These requirements are also necessary to remain in the division. If they are no longer met, the Darwin will be demoted to DarwinIA Silver.
- Once a Darwin has risen to DarwinIA Gold, it becomes public for private investors. This cannot be reversed even if the Darwin drops again.
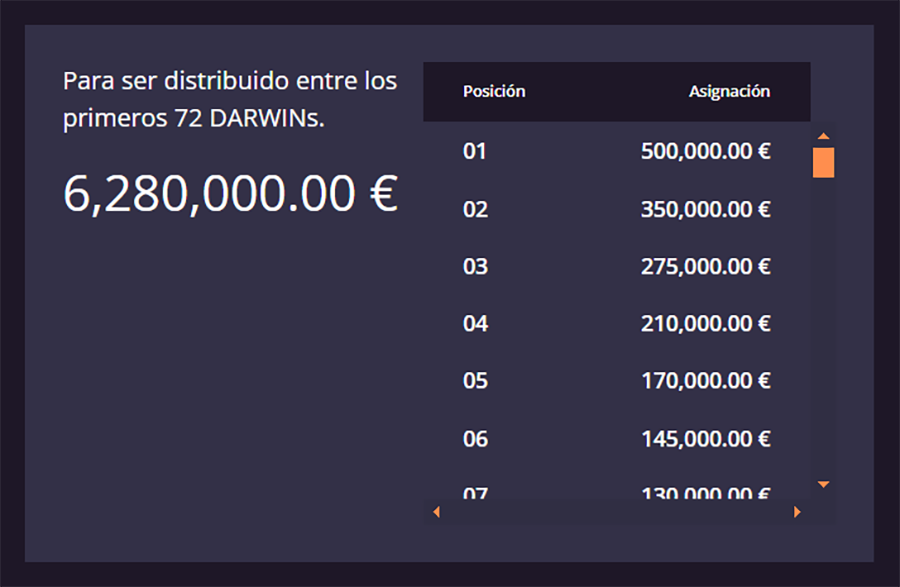
The first requirement to access DarwinIA Gold is to have a track record of at least 8 months. Subsequently, you will need to meet the requirements in some of these time periods.
| Profitability | Return/Drawdown | |
|---|---|---|
| 1 year | 20% | 2.5 |
| 2 years | 25% | 2.5 |
| 3 years | 30% | 2.5 |
| 4 years | 35% | 2.5 |
| 5 years | 40% | 2.5 |
Correlation
The correlation between two Darwins is a value that represents the similarity in the movement of their yield curves over the past 3 months. Correlation on Darwinex can have a value between -1 and 1.
- A value of 1 means that both Darwins move exactly the same.
- A value of -1 means that when the performance of one Darwin increases, the other decreases by the same proportion.
In both DarwinIA Silver and DarwinIA Gold, two Darwins with a correlation of 0.95 or greater cannot be allocated simultaneously. If this happens at the end of the month when the ranking is closed, only the Darwin with the highest return over the past six months will receive a capital allocation.

Darwinex Pro
Getting into and staying in DarwinIA Gold is already a feat within the reach of even the best traders, but if that’s not enough for you, there’s an even higher level. Darwinex Pro offers its traders the opportunity to manage capital in a completely professional manner, without all the costs and difficulties involved in creating a hedge fund from scratch.
To access Darwinex Pro, you must contact the Darwinex team directly, pass several quality filters and personal interviews, and pay an initial fee of $10,000, plus a minimum annual fee of $5,000, depending on the capital managed.
Among the services offered by Darwinex Pro, you can find legal and administrative management, marketing, VIP support for investors, and full control over commissions.
Knowledge Test Currently, regulations in Spain restrict the use of certain financial instruments for retail investors because they are considered dangerous or high-risk, and these instruments include CFDs. If you are a Spanish resident and want to create a CFD account with Darwinex Zero, you will need to pass a knowledge test. If you prefer the futures option, you will not need to take the test.
There’s no maximum time limit for answering the questions, but if you fail, you may not get another chance to take the test, so it’s best to take it easy and make sure you’re completely confident before answering.
Technical details
Broker
Darwinex is a regulated CFD and futures broker with a long track record and excellent reputation.
Platforms
It is possible to trade with Metatrader 4 and Metatrader 5
CFDs on US stocks, CFDs on US ETFs, futures, stocks, and spot ETFs can only be traded using Metatrader 5.
Instruments
Forex CFDs
We currently offer 42 currency pairs.
CFDs on commodities
- XAUUSD: Gold
- XNGUSD: Natural Gas
- XAGUSD: Silver
- XTIUSD: West Texas Crude
CFDs on indices
- AUS200: ASX 200 (Australia)
- FCHI40: CAC 40 (France)
- GDAXI: DAX (Germany)
- J225: Nikkei 225 (Japan)
- NDX: Nasdaq 100 (United States)
- SPA35: Ibex 35 (Spain)
- SPX500: S&P 500 (United States)
- STOXX50E: Eurostoxx 50 (Eurozone)
- UK100: FTSE 100 (United Kingdom)
- WS30; Dow Jones Industrial Average (United States)
CFDs on US stocks
Darwinex Zero currently offers direct market access (DMA) to the 30 constituent stocks of the DJIA and a selection of CFDs on the most liquid stocks from the NYSE (New York Stock Exchange) and Nasdaq markets. In total, approximately 800 US stocks.
CFDs on US ETFs
Darwinex Zero offers access to approximately 100 US ETFs from leading ETF providers such as Vanguard, iShares, Invesco, and more.
Futures
Darwinex Zero allows trading in a wide range of CME and Eurex futures across asset classes including currencies, industrial commodities, agricultural commodities, metals, indices, fixed income, and Bitcoin.
Cash Stocks and ETFs
The list of stocks and ETFs available in cash is the same as in CFD format.
Leverage
- Forex: 30:1
- Raw materials: 20:1
- Indexes: 20:1
- Stocks and ETFs: 5:1
These leverages apply only to CFDs. Spot stocks and ETFs are unleveraged, and futures leverage depends on the broker.
Commissions
Darwinex Zero has a great page on its website that details all the fees and technical aspects of each of its assets. Since there are many of them, I’ll leave the Link so you can review it for yourself.
Payments and withdrawals
Payment Methods
- Card
- PayPal
Withdrawal Methods
- Bank transfer
- Darwinex Wallet
Pay with winnings
Once you earn profits on Darwinex Zero, you can use this balance to automatically pay for your monthly subscription.
Unsubscribe
If you cancel your subscription, your account will be canceled from the moment your next payment is due. If this happens, your Darwin history will be lost and cannot be recovered.
Web
Darwinex Zero has a very easy-to-navigate website with all the information you need to understand their product and the services they offer. However, where you can truly appreciate the quality of their platform is in the trader dashboard.
Control Panel
Here you’ll find a wealth of powerful analysis tools for your Darwin and others participating in DarwinIA. You can also browse the DarwinIA leaderboard and manage your payouts and withdrawals.
Documentation
Darwinex Zero’s documentation is very good. Despite offering a completely different service than any other, it’s quite easy to understand how it works. Additionally, we also have Darwinex documentation, which explains certain concepts in more detail.
I particularly like the fact that it’s perfectly translated into Spanish. We can also read it in English, Italian, French, Chinese, Czech, and German.
Analyzing a Darwin
Knowing how to analyze Darwin’s behavior is key for both traders and investors looking for the best strategies for their portfolio. I’m going to focus more closely on the sections where understanding the different tabs can be most difficult, and ignore the most common and easy-to-understand parts.
Statistics (Return/Risk)

Annualized return
The average of what would be earned per year if the cumulative profitability observed up to that point were kept constant.
Daily standard deviation
Indicates how much the average daily returns deviate from the strategy’s average daily return. The higher the deviation, the greater the volatility. Above 1% is a volatile strategy, and above 2% is a very volatile strategy.
Annualized volatility
As its name suggests, it represents the strategy’s volatility over a year. It is calculated directly based on the daily standard deviation and the number of trading days, so in practice, the two values provide the same information.
In this case, anything above 15% would be a volatile strategy, and anything above 30% could be considered a very volatile strategy.
Sharpe Ratio It’s one of the most widely used metrics in the investment world, as it gives a very clear general idea of how good a strategy is. It measures the relationship between the performance of a trading strategy and the risk assumed to achieve that performance. The performance of a risk-free investment, such as US bonds, is used as a reference.
This metric requires a large sample size over a long period of time to be significant. A value below 1 indicates a poor strategy that is unlikely to appeal to investors due to its poor price-to-return ratio. Values above 2 over a multi-year track record are very difficult to maintain and would indicate an extremely robust strategy.
Sortino ratio It’s the same as the Sharpe ratio, but only counts negative volatility, not the kind that produces profits. Some traders with a strong understanding of the market can take advantage of volatility without suffering much from its negative consequences, so this value may be a more accurate representation of the robustness of their strategy.
Asymmetry
Skewness measures the relationship between the size of wins and losses. A positive skewness indicates that the strategy generates larger wins than losses, while a negative skewness indicates that the strategy generates larger losses than wins.
Kurtosis
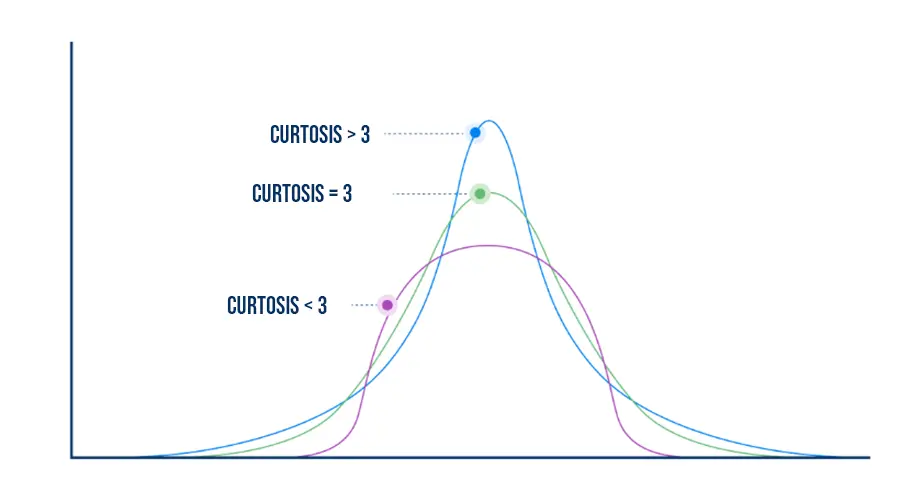
It is a statistical measure that describes the shape of the return distribution of a trading strategy, specifically in relation to the distribution’s tails. The higher the value, the flatter the curve, and the more weight the tails have.
This is another way of measuring volatility that can help provide a more complete picture of how the strategy is performing. Darwinex Zero uses what is known as raw kurtosis, where the normal value is 3. A very high value can be dangerous, as it suggests a high probability of extreme profit or loss events, while a very low value indicates that the strategy is very stable and predictable, with most values close to the mean, but that it may not maximize returns.
Profitability distribution
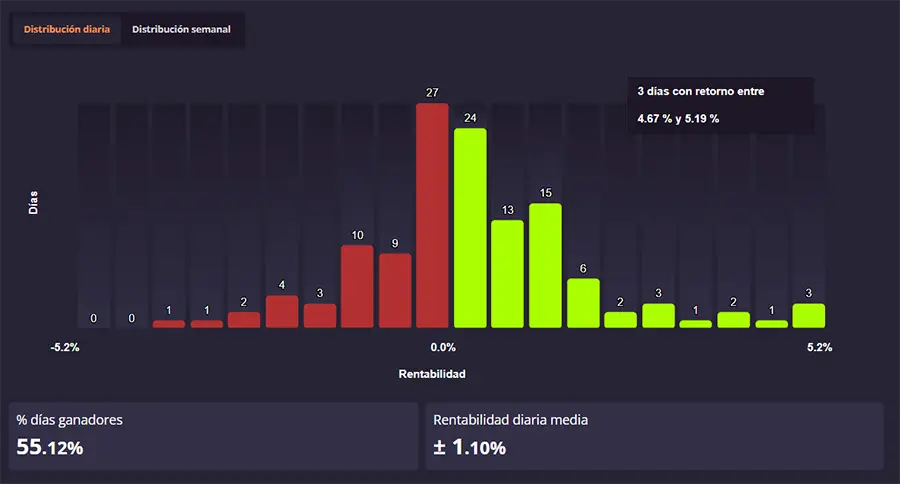
Chart showing the strategy’s profitability for each day or week. Here we can see metrics such as skewness and kurtosis represented more graphically.
In this example, we can observe a flattened curve with large tails, which corresponds to high kurtosis. We can also see how the tail of the gains is much heavier than the tail of the losses, which corresponds to high positive skewness.
Statistics (Strategy Analysis)

% Long Exposure
If the value is greater than 50%, the number of long trades outweighs the number of short positions. Strategies with a significantly higher number of either are likely trading trend-following assets or under some type of bias. While this isn’t bad per se, it does add an extra risk factor to the strategy, as its performance could be significantly affected by market conditions.
Imagine a strategy that is super profitable at the end of 2021, with a two-year track record, primarily trading American indices, and with an 80% long exposure. If we analyze the situation, we can assume that this Darwin depends heavily on the upward trend of the indices, and will very likely earn much less, or even lose, when the economy becomes more complicated and these assets correct.
Profit factor
It is the ratio of gross profit to gross loss. It measures the effectiveness of each individual trade. The profit factor must be greater than 1 for the strategy to be profitable.
A profit factor close to 1 indicates that the strategy barely offsets losses with profits, requiring a large number of trades to generate significant returns. Conversely, a strategy with a high profit factor can achieve good results with a smaller number of trades, as each trade provides a larger profit margin relative to losses.
% Winners
In trading, thanks to asymmetric risk, it’s not necessary to win more trades than you lose. If a strategy’s payoff ratio is greater than 1, the strategy can be profitable even if it wins less than half the time.
Payoff ratio
The payoff ratio is defined as the quotient between the average profit per winning trade and the average loss per losing trade:
This indicator is crucial because it greatly influences how trading is managed and the viability of the strategy. If the payoff ratio is greater than 1, it means the strategy gains more when it’s right than it loses when it’s wrong. If it’s less than 1, the opposite is true. It’s important to note that this ratio has no defined maximum limit, but it cannot be lower than 0.
Although there are no absolute rules, a payoff ratio considered “healthy” will generally not be less than 0.5 and not more than 4:
-
Payoff ratio > 2–4: High-yield strategies typically rely on winning large amounts in single trades while accepting a low percentage of success. This approach can be psychologically difficult for manual traders due to the frequency of losing trades. However, if the strategy is algorithmic, this psychological effect is minimized, as decisions are executed by the system, eliminating emotional influence.
-
Payoff ratio < 1: These strategies rely on accumulating small, frequent profits, which can be attractive to manual traders due to the perceived high success rate. However, they face a significant risk of hidden ruin: when losses occur, they are often large. If several consecutive losing trades occur, the impact on the account can be catastrophic.
Duration ratio
The duration ratio measures the relationship between the average time that winning trades remain open and the average time that losing trades remain open:
- Duration ratio > 1: Winning trades tend to last longer than losing ones, which may indicate a focus on letting profits run and cutting losses quickly. In manual trading, letting profits run to maximize profitability is a complicated process that requires great discipline and analytical precision, so these strategies tend to be more reliable.
- Duration ratio < 1: Losing trades last longer than winning ones. While this isn’t necessarily a bad thing, in many cases it can be due to the trader’s difficulty in taking losses, which can be dangerous in the long run.
Maximum positive/negative excursion per position
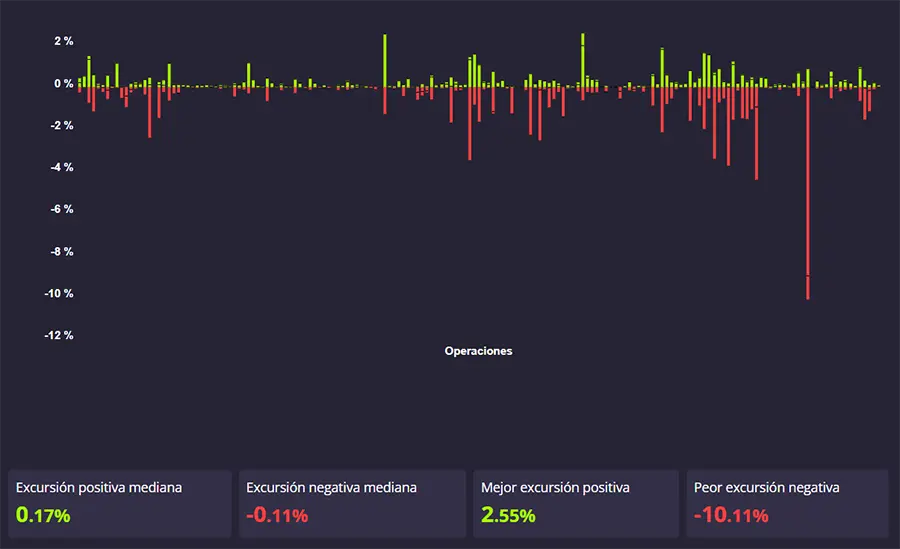
I think it’s pretty clear and well explained in the Darwinex Zero app itself, but I think it’s worth commenting a bit, as there are quite a few conclusions to be drawn from these metrics:
- Management comparison between profit and loss
- Consistency in position management. Ideally, we should see most bars have a similar length, especially losses.
- Abnormally large losses. In this example, we can see how one position can reach a loss of up to 10%. This is a very high percentage for a single position and can seriously jeopardize the integrity of Darwin.
Signal Account Risk Management
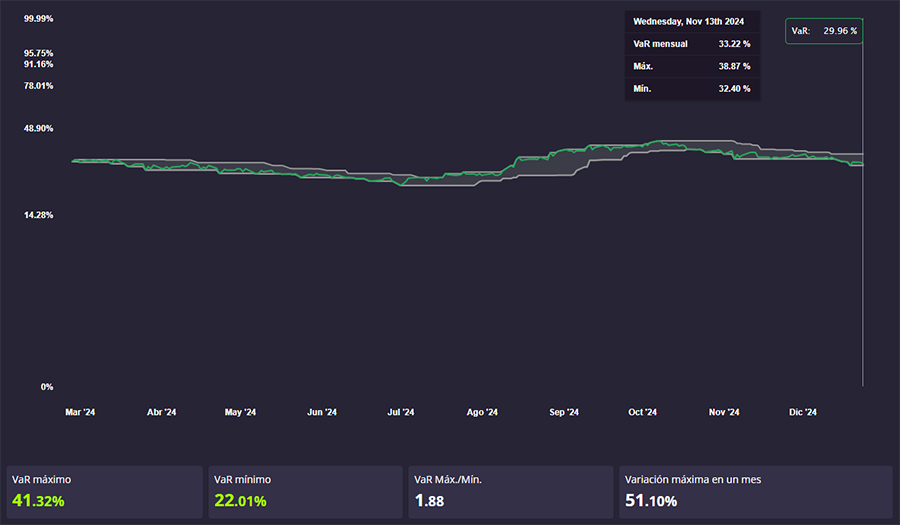
In this chart, we can see the historical VaR of the underlying account. A lot of important information can be gleaned from analyzing it:
- If the value is inconsistent over time, it could mean several things: an adaptation of the strategy, poor risk management, and/or a lack of clear rules and criteria for trading.
- In principle, it doesn’t matter whether the VaR is high or low, as the risk engine will adjust it to an optimal level. Only extremely high levels could be problematic, jeopardizing the integrity of the underlying account.
- As traders, it’s vitally important to be aware of how the risk engine is adapting to our strategy. If we’re having trouble with the multiplier, this chart can be very useful for comparing how we were trading in each time period and how that affected the risk engine adjustments. Remember that the engine takes into account the last 45 trading days, so changes to the multiplier usually arrive with a greater or lesser delay, depending on the magnitude of the variations in the underlying account’s VaR.
Monthly rotation
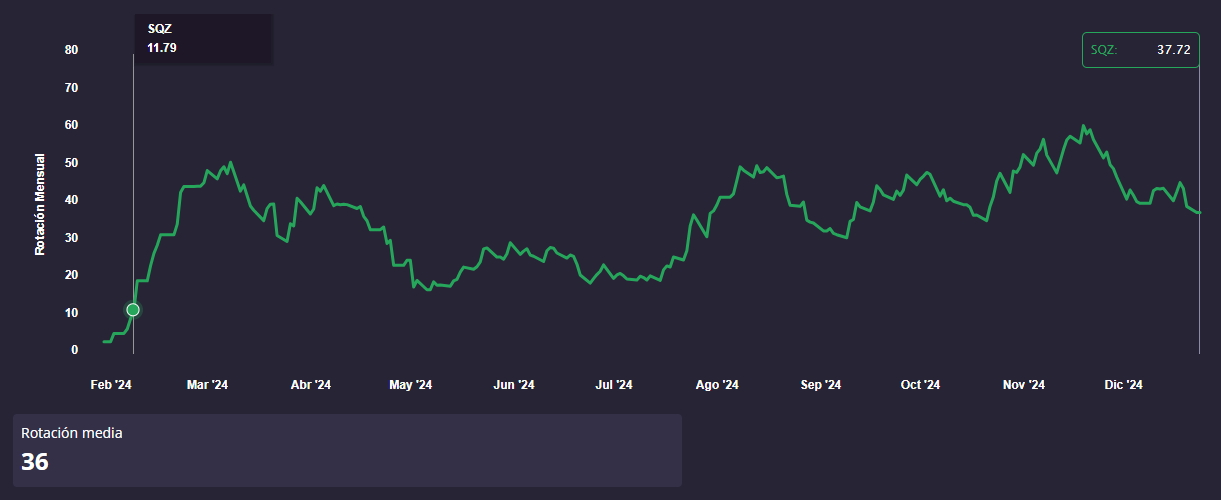
This chart represents the total volume traded by Darwin during the previous month at each point. If I’m not mistaken, the value is calculated relative to the Darwin’s quoted value, assigning a balance of $100k to a Darwin with a quoted value of 100k, and $1k for each quoted value above or below 100k. This question arises because Darwinex’s documentation appears to be outdated, as it explains a monthly turnover of the signals account, not the Darwin.
For example, if 10 lots of EURUSD were traded on a Darwin with a quote of 100, the total volume of which would be $1 million, the monthly turnover would be 10, since $1 million is 10 times $100k.
Personally, this is a graph I find difficult to understand. The main aspect to consider is the stability of the signal; if the values change significantly over time and don’t follow a clear pattern, there’s likely a consistency issue.
I understand that these values already have the risk engine multiplier applied, so the variations will not have much to do with the risk management of the underlying strategy, but rather with other types of changes in the strategy.
Be careful when promoting your Darwin
One of Darwinex Zero’s magic tricks is offering any retail trader the ability to manage third-party capital. To do this legally in most countries, you must have a professional certification and comply with certain bureaucratic processes.
If you’re a retail trader, while you can take advantage of these benefits, you’re still not authorized to offer investment recommendations or promote certain types of financial services. Darwinex clearly washes its hands of this matter and DOES NOT ALLOW anyone who doesn’t hold the appropriate license in their country of residence to promote a Darwin.
As I understand it, there’s no problem with sharing your Darwin results for informational purposes on your social media, as long as you watch your language and don’t make it too obvious that you’re trying to convince anyone to invest in it.
How to get the most out of Darwinex Zero
- I don’t recommend it for beginners. Only if you win at least as much as you lose should you consider paying for a subscription.
- Be very careful when mixing different types of entries and strategies. If you do, make sure they are well balanced in terms of volume, volatility, and duration. Otherwise, the risk engine won’t be able to adjust properly, and Darwin’s profitability could be severely affected.
- The longer a Darwin’s lifespan is, the less worthwhile it is to restart it, even if it has a prolonged losing streak. Drawdowns are normal, and the ability to overcome them can be highly valued by potential investors in the future.
- The lifetime allowance is well worth it for traders who are confident they are profitable, but it can be an unnecessary expense for those who are not.
- Focus on trading well in your underlying account and don’t obsess over how your Darwin is doing. If you see your Darwin consistently underperforming, analyze why, but don’t try to continually adapt to the risk engine’s adjustments. If you worry too much about this, you’ll start making decisions that aren’t part of your strategy and could lose control.
My opinion on Darwinex Zero
Darwinex Zero is a unique product currently unavailable from any other company. These two formats are perfectly compatible, so there’s no need to choose between one or the other; instead, you can leverage the strengths of each.
Personally, I love Darwinex Zero and its bigger cousin Darwinex, and I don’t see the vast majority of traders not using them.
What I like the most
- Total absence of rules. Trading is about one thing: winning more than losing, and this can be achieved in many ways. Don’t lose your account, don’t limit your trading, focus on winning.
- Alignment of interests. Darwinex Zero is designed to ensure that the trader’s profit always represents a profit for Darwinex. This is not the case with conventional funding companies, where most traders’ profit comes from the company’s funds.
- DarwinIA. I think it’s very well-designed and can be very profitable for good traders. The watermark reset makes losing streaks much less impactful.
- Third-party capital management. While the vast majority of traders will benefit significantly from DarwinIA’s program, their ultimate goal should be to attract large external investments, and that’s something that can only be achieved here today.
- Analytics tools. You can learn a lot about your trading thanks to the dashboard metrics.
- Lifetime allowances can be very lucrative for solid traders.
What I like least
- The risk engine allows for no rules, but it can be a double-edged sword if we don’t understand and adapt to how it works.
- The risk engine adjusts based on the past 45 days of trading history. This can be a very small window for swing trading strategies that continually adapt to market conditions.
Don't miss anything!
Get the latest news, exclusive promotions and funded trading analysis directly in your inbox
